

Protect your margins with real-time financial visibility
Protect your margins with real-time financial visibility
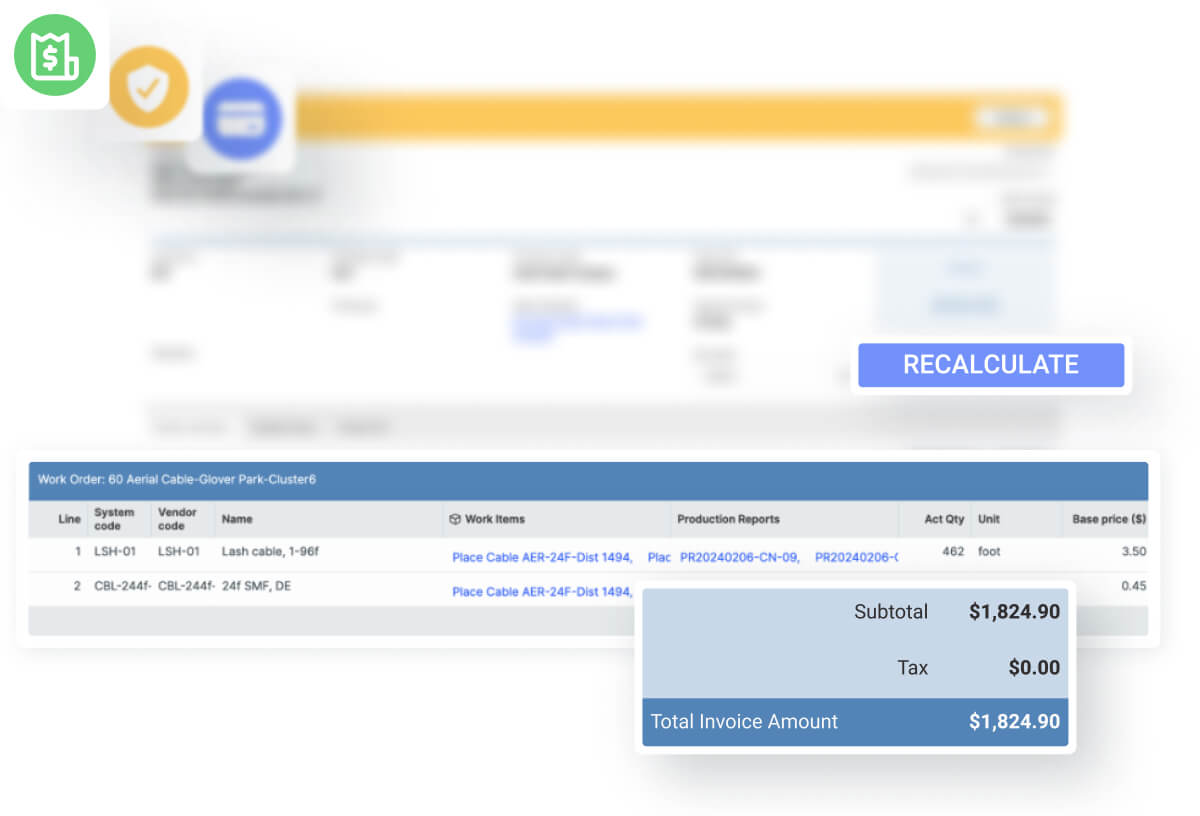
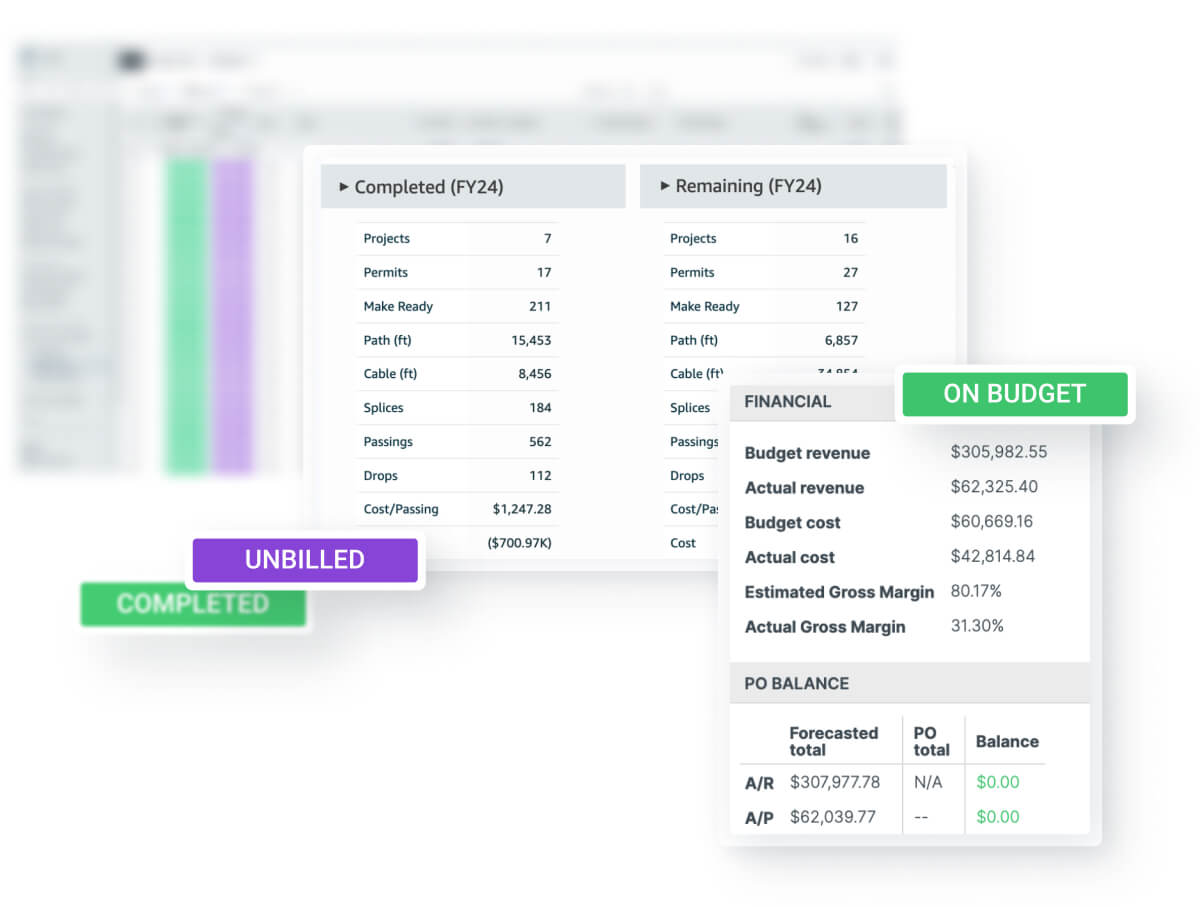
Track costs and performance as they happen. Vitruvi gives your teams instant access to job cost data, helping you eliminate guesswork, reduce overspend, and improve forecasting accuracy.
- Generate up-to-date job cost and margin reports.
- Align field and office teams on financial health.
- Spot budget issues before they impact profitability.
Bring all your data together in one source of truth
Bring all your data together in one source of truth
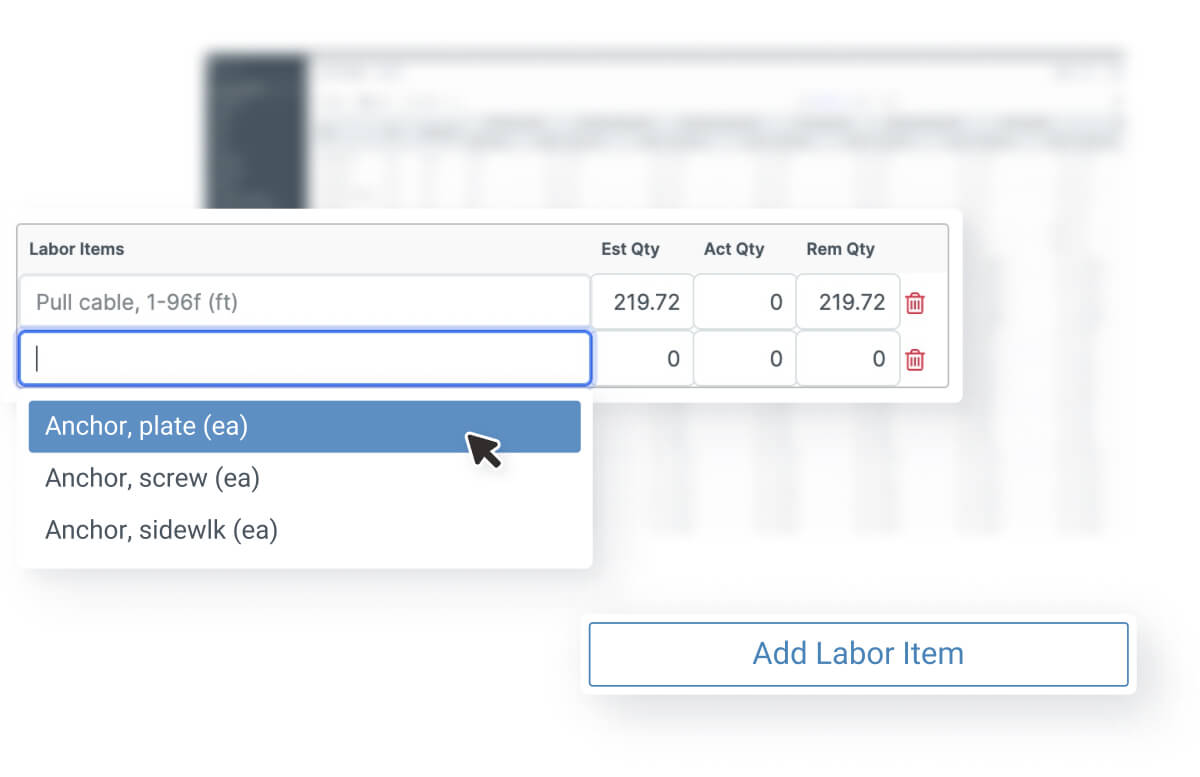
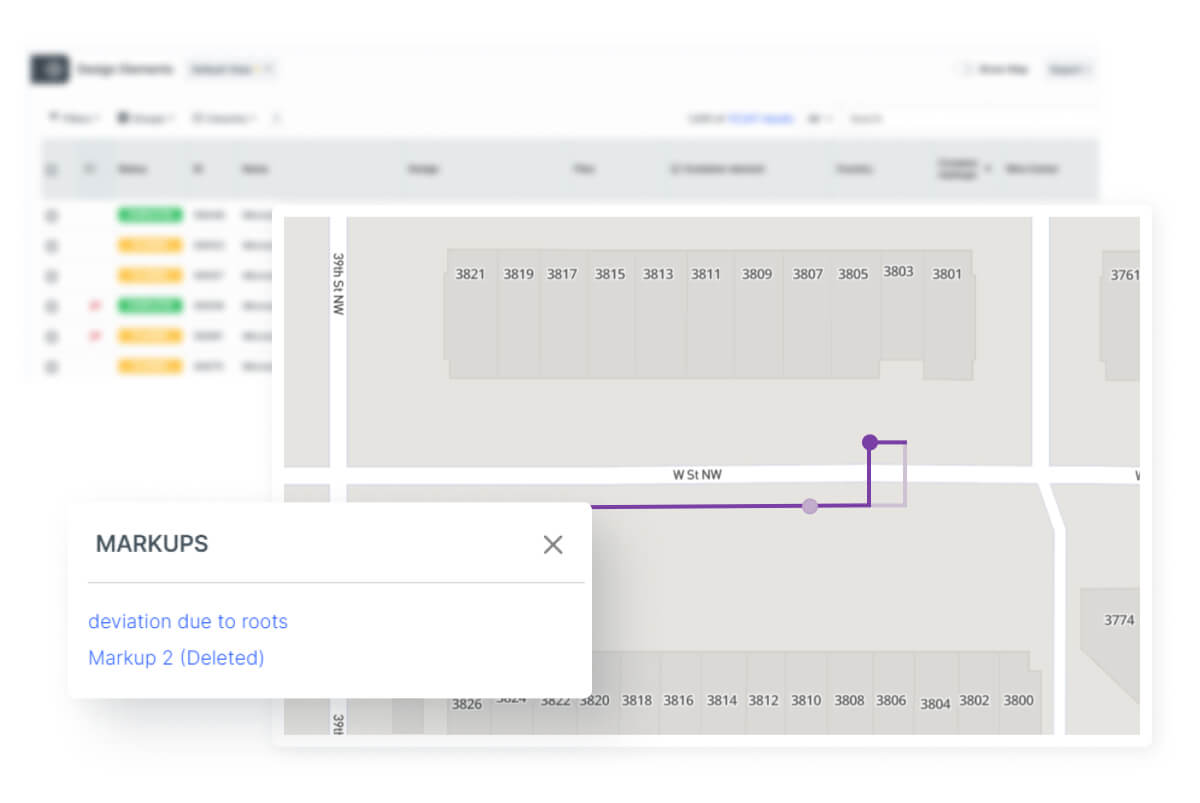
Disparate systems create blind spots. Vitruvi centralizes your construction data across departments and tools, giving you a unified view of every project.
- Integrate with ERP, OSS/BSS, scheduling, and financial systems.
- View project- and portfolio-level insights in a single platform.
- Eliminate manual data entry and inconsistencies.
- Reduce errors and redundancies with synced data flows.
Keep teams aligned with automated, real-time reporting
Keep teams aligned with automated, real-time reporting
Manual reporting slows down decision-making and invites errors. Automate reporting with construction data analytics software designed to eliminate manual work. Vitruvi streamlines your reporting process with automated, scheduled, and on-demand reports, so everyone stays aligned, without the extra lift.
-
Schedule recurring reports or generate on-demand insights.
-
Share read-only views for transparency and collaboration.
-
Export to project tools like P6 or integrate with reporting systems.
Spot red flags early with AI-powered insights
Spot red flags early with AI-powered insights
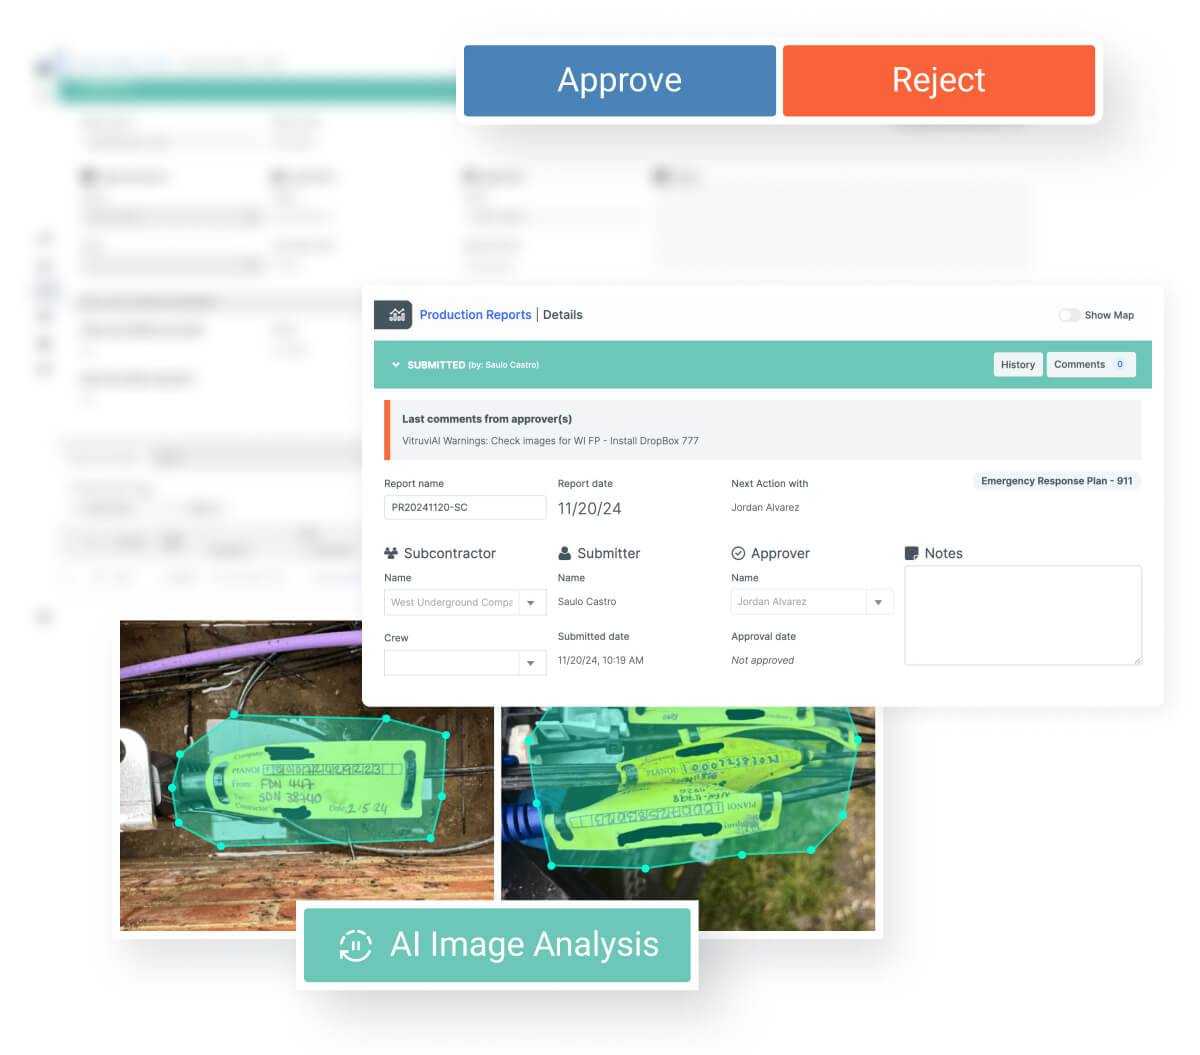
Delays and cost overruns often start as small issues. Vitruvi AI Labs analyzes historical and real-time data to detect early signs of risk, so your teams can act before problems impact your schedule or bottom line.
- Analyze project data for risk patterns in safety, quality, and controls.
- Highlight high-risk areas across design and execution.
- Receive proactive alerts to keep projects on track.
Seamless connections to the tools you already use
Seamless connections to the tools you already use
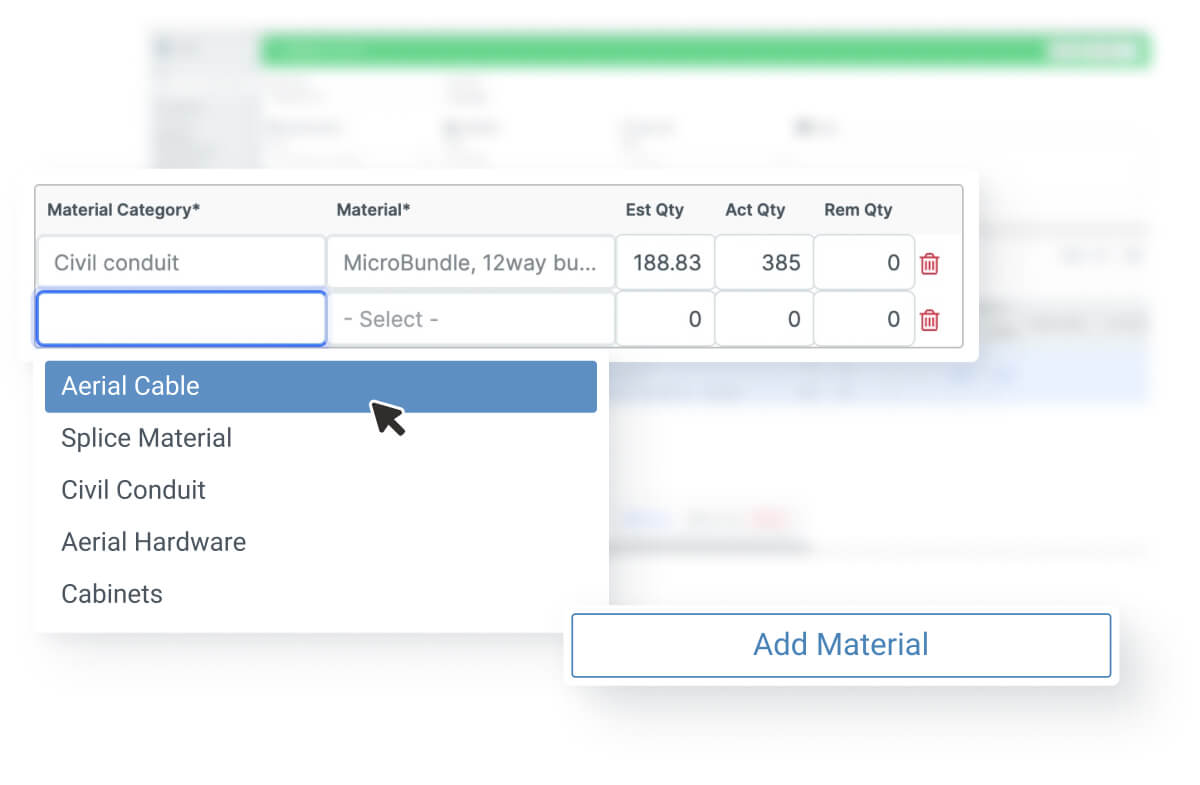
Your construction data works best when it moves freely. Vitruvi integrates directly with your existing tools, enabling smooth data flow and reducing friction across every phase of the project, without compromising data integrity.
- Sync data with your internal environments and tools.
- Use APIs to connect with your broader technology stack.
- Maintain consistency and accuracy across multiple systems.
Bring clarity to complexity with visual insights
Bring clarity to complexity with visual insights
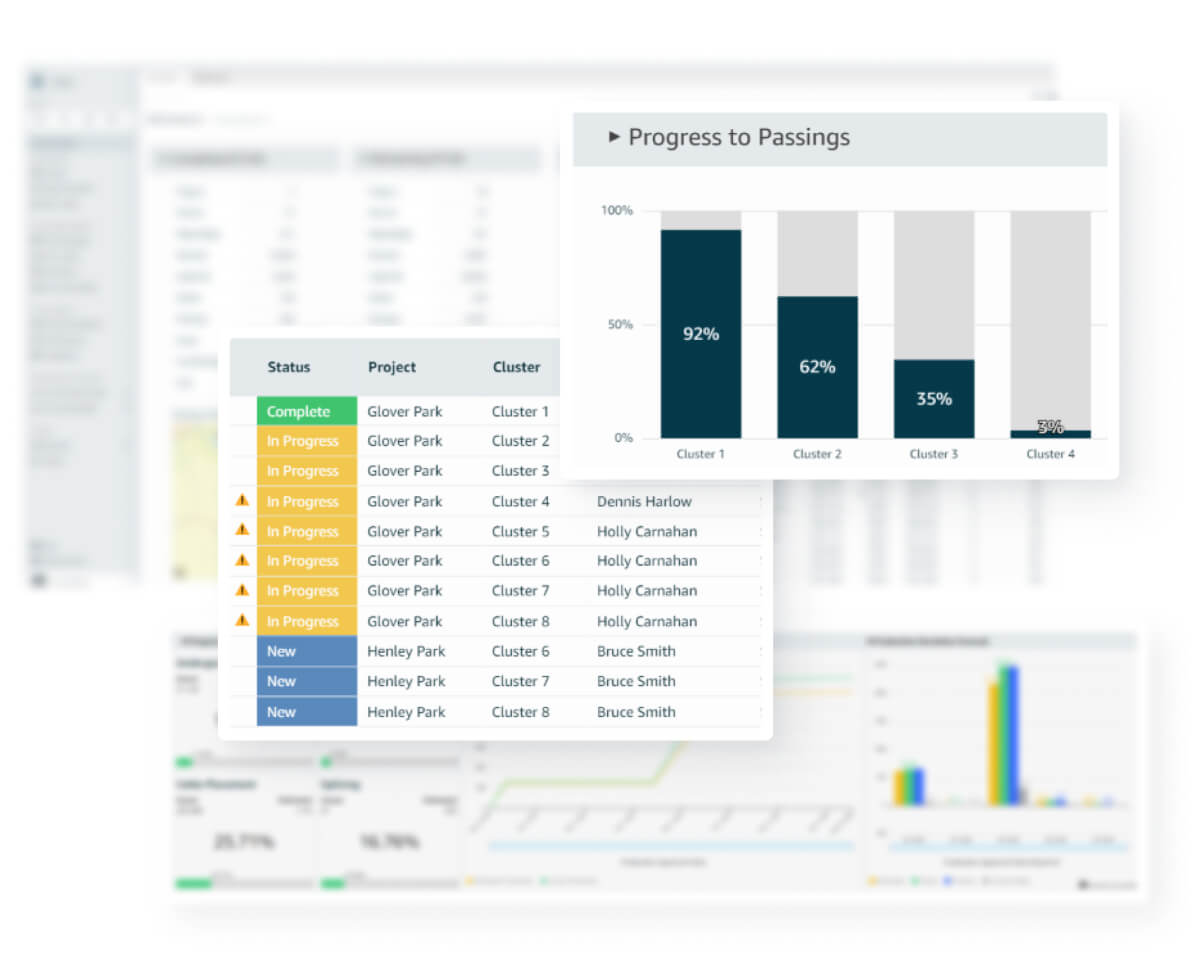
Understanding project health shouldn’t require digging through rows of data. Vitruvi delivers real-time visualizations that highlight patterns, trends, and performance, making it easier to spot what’s working and what needs attention. Interactive dashboards and visual reports help your teams quickly identify what’s working and where attention is needed.
- Use pre-built templates to view key project metrics instantly.
- Filter and segment data for deeper, on-the-fly analysis.
- Export visuals to PDF, Excel, GeoJSON, or PNG for easy sharing.
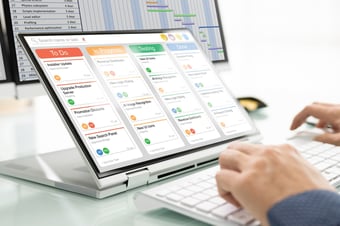
Streamline tasks and keep projects moving
Streamline tasks and keep projects moving
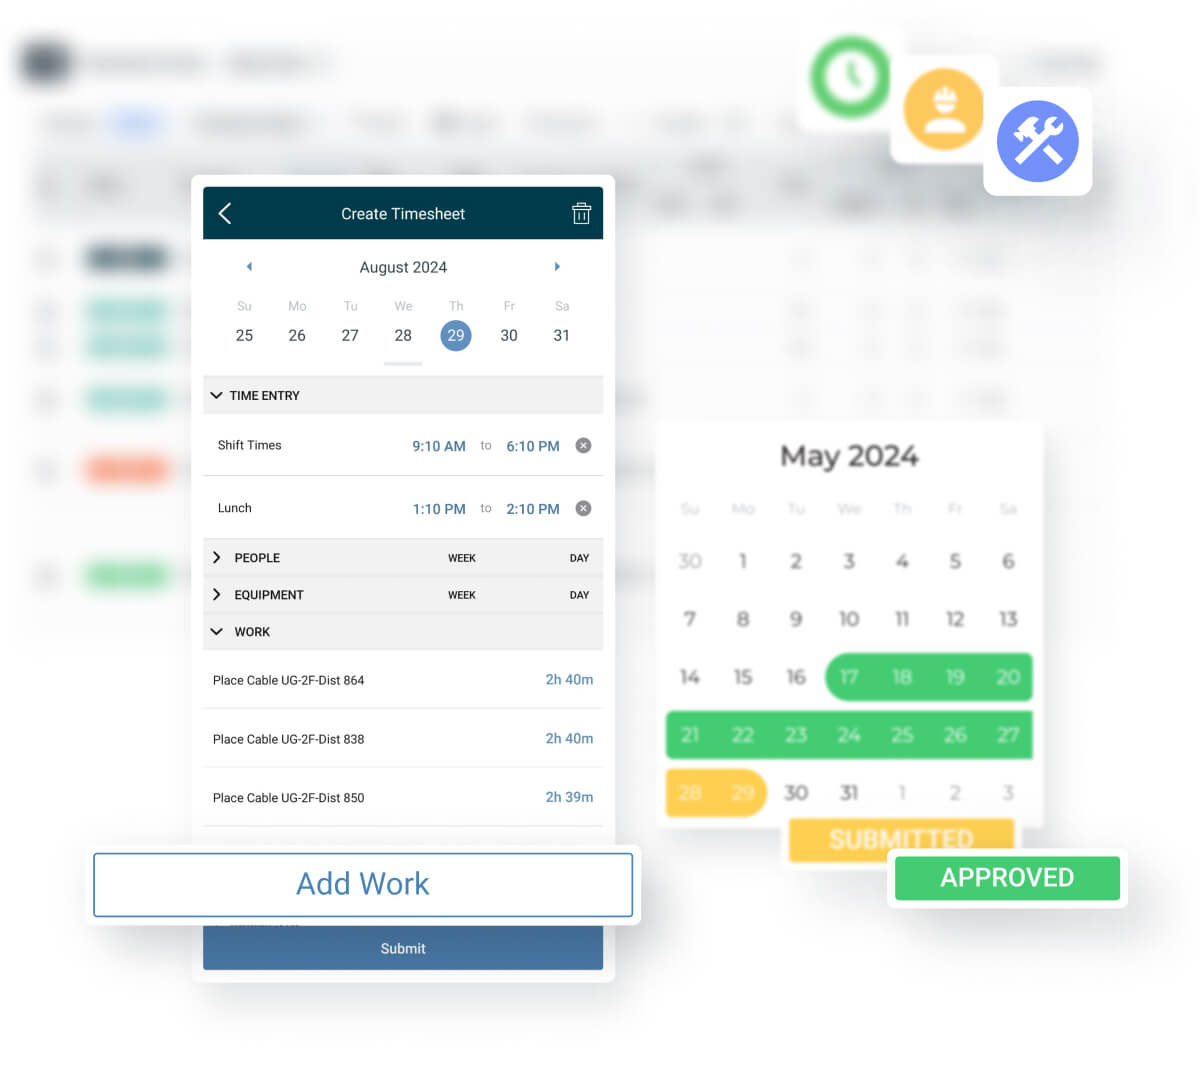
Manual processes slow teams down. Speed up data collection and reporting with automation features built into Vitruvi’s construction data analytics software. We automate routine reporting and data workflows, helping you move faster, reduce friction, and focus on the work that matters most.
- Configure recurring tasks and report generation.
- Extract and transform data with a single click.
- Automatically share updates with stakeholders.
Adapt your views to focus on what matters most
Adapt your views to focus on what matters most
Every project has unique priorities. Vitruvi lets users filter dashboards by project or portfolio, manage KPIs and metrics without coding, and leverage advanced reporting tools for deeper insights. Our flexible tools let users of all technical levels build exactly what they need to track performance.
- Filter dashboards at the project or portfolio level.
- Manage KPIs and performance metrics with ease.
- Integrate with advanced reporting tools like Power BI for enhanced analysis.

Bulldog Your Construction Projects
Most Popular Resources

Resource Allocation in Construction: Strategies for Infrastructure and Linear Projects

Critical Path Method Construction Scheduling: Complete Guide for Construction Projects

Construction Scheduling Methods: A Complete Guide for Modern Projects

How to Create a Construction Schedule: Step-by-Step Guide, Tools, and Best Practices

AI Utilities Construction Applications for Modern Linear Infrastructure
-3.png?width=340&name=image%20(1)-3.png)
Best AI Tools for Construction: Project Management, Safety, and Site Operations

Construction Project Management Plan: Components, How to Build One, & More
.png?width=340&name=image%20(58).png)
Construction Daily Reports: Complete Guide to Accurate Site Documentation

How to Plan a Construction Project: Step-by-Step Guide for Infrastructure Projects

Construction Planning: Definition, Process, and Best Practices for Infrastructure Projects

What is Construction Scheduling?

Construction Resource Management: Strategies, Tools, and Best Practices for Infrastructure Projects

Quality Control vs Quality Assurance in Construction: Key Differences Explained
-3.jpg?width=340&name=imresizer-image%20(2)-3.jpg)
Quality Control in Construction: Processes, Tools, and Best Practices for Infrastructure Projects
.png?width=340&name=image%20(7).png)
Construction Quality Control Checklist: Essential Checklists for Infrastructure and Civil Projects
.png?width=340&name=image%20(1).png)
Construction Quality Management Systems: Complete Guide to QMS in Construction

Feature Highlight: Vitruvi AI Field Inspector

Comprehensive Guide to Construction Reporting

How to Choose the Right Construction Management Software for Your Business

A More Flexible Way to Build with Vitruvi

Reflections on 2025 and Why Integrated Operations Will Drive Success in 2026

2026 Utility Forecast and Recommendations from Leading Industry Sources

Planning for Next Year’s Fiber Surge? Use Data Insights to Learn From This Year’s Build Season

How to Avoid Delays in Construction Projects

When the Lights Must Stay On

How to Maximize Crews and Equipment to Hit Q4 Goals

How to Improve Productivity on a Construction Site
.png?width=340&name=Heading(7).png)
Don’t Leave Solo Sam Hanging

The Quiet Quarter: Why Q4 is When Smart Operators Get Ahead of 2026 Maintenance and Compliance Risk

Construction KPIs: Key Metrics for Successful Project Management

Maximize Q4 Builds: Resource Planning That Keeps Fiber Rollouts on Track

11 Best Construction Management Software for 2025

The Best Procore Alternatives for Construction Teams in 2026

Start in Q4, Power Ahead in 2026: The Faster Path to Renewable ROI

Five Ways Utlities can Get a Fast Start on 2026
.png?width=340&name=Heading(9).png)
Set Mismatched Mike Up for Success

No More Slow Starts: Why Fiber Providers Need to Build 2026 Momentum Now

Top 9 Benefits of Using Cloud Construction Software

Racing the Sun: Keeping Renewable Projects on Track Through Year-End

The Final Mile: Why the Last 90 Days Decide the Next 365

Best Cloud-Based Construction Management Software for 2025 Projects

Best 10 Construction Inventory Management Software for Smarter Jobsite Control

Great Opportunities Ahead for Our QA Partner

$289 Million Says You Can’t Afford to Ignore Utility Compliance

Avoiding Delays and Fines
Top 8 Telecom Project Management Software Solutions

Risk, Fines, and Shutdowns: How Construction Management Platforms Keep Oil & Gas Projects Regulatory-Ready

Fiber Deployments in a Regulatory Maze?

The Power Grid’s Biggest Threat? Aging Assets
Predictive Maintenance in Renewable Energy: 6 Myths That Could Be Costing You
From Downtime to Uptime: How Vitruvi Helps Prevent Costly Equipment Failures in Oil & Gas

9 Best Construction Data Analytics Software

Top 9 Civil Construction Project Management Software Solutions

Top 8 Renewable Energy Project Management Software Solutions

A Day in the Life of a Fiber Field Technician

From Fiber Rollouts to Long-Term Reliability: AI-Driven Maintenance for Network Stability
.jpg?width=340&name=LinkedIn%20Posts%20%26%20newsletter(6).jpg)
Building Smarter Grids: How Quality Control Technology Reduces Utility Project Failures

Utility Construction Software
Built Right the First Time: How Field Validation Keeps Renewable Projects Aligned with Funding and Compliance Milestones

Stage 3:From Groundbreaking to Service – How to Deliver Fast, Controlled Renewable Project Execution

No Surprises, No Shutdowns: Real-Time Construction Tracking for Oil & Gas Projects

Eyes on the Ground: Eliminating Fiber Deployment Delays with Real-Time Progress Tracking

Stage 2: From Planning to Permits – How to Set Your Renewable Project Up for Speed and Success

Avoiding the Permitting Bottleneck: AI’s Role in Smarter Grid Expansion

What is Construction Data Management?

What is a Construction Management System? (Top 12 Platforms to Use)

Top 8 Pipeline Construction Software Platforms (2026) | Vitruvi

Best AI Construction Software Platforms (2026)

Top Construction Software for Field Operations Managers

Stage 1: From Site Search to Smart Selection – How to Identify High-Impact Renewable Energy Projects

Cutting Red Tape: How AI is Fast-Tracking Wind & Solar Project Approvals

Sitetracker Competitors: A Comprehensive Guide
Drilling Down on Delays: How AI Speeds Up Site Approvals in Oil & Gas

A Guide to Data Analytics in the Construction Industry

Permits Without the Pain: AI-Enhanced Site Selection for Fiber Rollouts

The Cost of Unsafe Utility Construction
Optimizing Utility Workforce Management Amid Increased Demand for Undergrounding Electric Cables

The Aging Infrastructure Crisis

Solving the Labor Shortage Puzzle in Renewables

Budget Overruns in Utility Construction

From Chaos to Clarity

Avoiding Costly Miscommunication

Bridging the Gap:

Keeping Pace with Innovation
Preventing Utility Delays with AI-Powered Budget Control

Untangling the Red Tape

Top Subcontractor Management Software Solutions (Guide)

How AI Transforms Cost Control in Renewable Energy Projects

Bridging the Utility Labor Gap

Building a Sustainable Future: How Digital Tools Can Drive Renewable Energy to Meet 2030 Goals

Avoiding Overruns with AI Forecasting in Oil & Gas Megaprojects

Vitruvi Software Secures Marquee Clients in a Record Quarter, Advancing AI-Powered Innovation in Linear Infrastructure Construction

Improving Transparency and Accountability in Utility Projects with Real-Time Reporting

Weathering the Storm

Vitruvi Software Unveils Groundbreaking AI Capabilities at Exclusive Industry Event

The Estimated Spend on Utilities in Every U.S. State

Fiber Network Builds Bleeding Cash?

Fiber Network Management Software Solutions (Guide)